Copyright © 2026 - orienthink Team. All Rights Reserved
Information from your device can be used to personalize your ad experience.

Copyright © 2026 - orienthink Team. All Rights Reserved
Information from your device can be used to personalize your ad experience.
Master the top data analysis techniques for business decisions. Learn how to transform raw data into actionable insights with this complete guide.

Businesses already collect information from sales, customers, websites, marketing campaigns, operations, and finance, but having data does not automatically reveal what to do next. In this guide, you’ll learn the main data analysis techniques for business, the questions they answer, where they are used, and how to choose the right method for a specific business problem.
Key takeaways
Business data analysis techniques are methods used to examine and interpret business data to identify patterns, answer questions, measure performance, and support informed decisions. For example, a retailer can analyze monthly sales data to discover which products are growing, declining, or performing differently across locations.
First, business data analysis connects raw information with a specific business question. A sales database may contain thousands of transactions, but analysis turns those transactions into useful measures such as revenue trends, customer segments, product performance, or demand forecasts.
At the same time, analytics types and analysis techniques are not exactly the same thing. Descriptive, diagnostic, predictive, and prescriptive analytics describe broad analytical purposes, while regression, segmentation, forecasting, correlation, and visualization are specific techniques used to achieve those purposes.
For example, descriptive analytics may use statistical summaries and visualization to explain sales performance, while predictive analytics may use regression or forecasting to estimate future sales.
Data analysis techniques are important because they help businesses replace unclear assumptions with structured evidence when making decisions. For example, a business can analyze customer purchasing patterns before changing its product mix instead of relying only on intuition.
Moreover, analysis can support several important business activities:
In addition, data quality strongly affects analytical results. AWS recommends validating data quality and addressing missing values, inaccuracies, anomalous data, and incorrect data types before relying on analytical outputs. Source: Amazon Web Services, 2025.
A recent IBM survey of 1,700 chief data officers found that 92% said they must focus on business outcomes to succeed, while only 29% reported having clear measures for determining the value of data-driven business outcomes. Source: IBM, 2025.
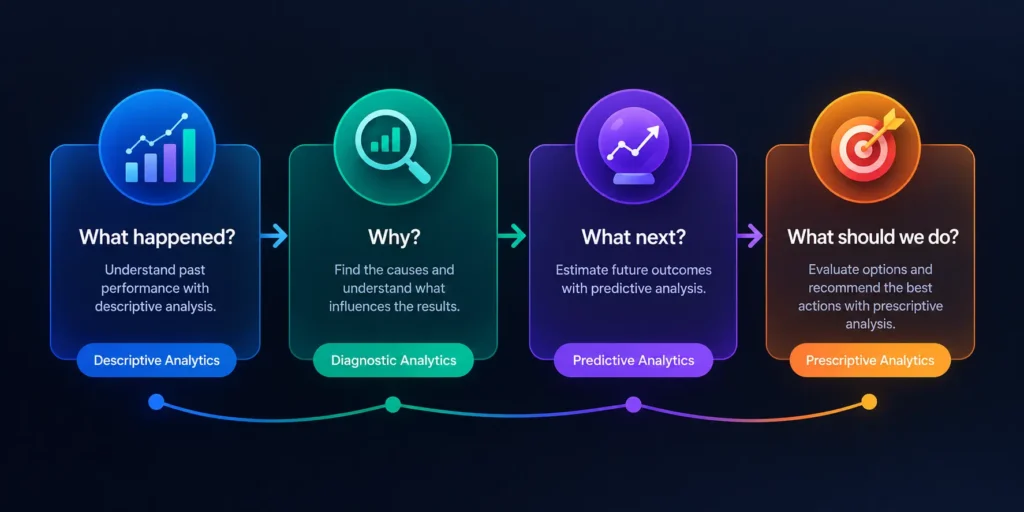
The four main types of business data analysis are descriptive, diagnostic, predictive, and prescriptive analytics. For example, a retailer can use all four approaches to move from understanding last month’s sales to deciding how to respond to expected demand.
| Analytics type | Main question | Typical purpose | Example |
| Descriptive | What happened? | Summarize past performance | Monthly sales report |
| Diagnostic | Why did it happen? | Identify causes and relationships | Investigating a sales decline |
| Predictive | What may happen? | Estimate future outcomes | Demand forecasting |
| Prescriptive | What should we do? | Evaluate possible actions | Inventory allocation |
Descriptive analysis summarizes historical data to explain what has already happened. For example, an online store can calculate monthly revenue, average order value, product sales, and website conversion rates to understand recent performance.
First, common descriptive methods include totals, averages, percentages, frequency distributions, trend charts, dashboards, and summary tables. These methods are especially useful when managers need a clear view of current or historical performance.
For example, a business might discover that revenue increased by 12% during one quarter while the number of orders increased by only 4%. That difference creates a useful starting point for deeper analysis.
Diagnostic analysis investigates why a particular business outcome occurred. For example, if sales declined, diagnostic analysis can compare products, regions, customer groups, prices, traffic sources, and time periods to identify contributing factors.
Moreover, diagnostic analysis often combines techniques such as variance analysis, segmentation, correlation analysis, filtering, drill-down analysis, and comparative analysis. The goal is not merely to describe a problem but to investigate its possible causes.
For example, a company may discover that overall sales fell because one major product category experienced a sharp decline in a particular region. IBM describes diagnostic analytics as an approach focused on uncovering root causes, performance gaps, and patterns. Source: IBM, 2025.
Predictive analysis uses historical data, statistical methods, and analytical models to estimate what may happen in the future. For example, a retailer can use previous sales, seasonal patterns, promotions, and other variables to forecast future demand.
Furthermore, predictive analysis can support customer churn prediction, sales forecasting, demand planning, credit-risk assessment, and workforce planning. Regression and time-series forecasting are common techniques used for these purposes.
Predictive results are estimates rather than guarantees. A forecast of increased demand, for instance, can help a company prepare inventory, but unexpected market conditions can still change the outcome.
Prescriptive analysis evaluates possible actions and helps determine which actions may produce desirable outcomes under defined conditions. For example, a company can analyze demand, inventory levels, delivery costs, and capacity to evaluate different inventory allocation decisions.
At the same time, prescriptive analytics generally requires more complex data, models, constraints, or optimization methods than basic descriptive analysis. IBM defines prescriptive analytics as using data and predictions to determine potential courses of action and recommend the best path forward to achieve optimal business outcomes.
These four analytical approaches work together rather than functioning as isolated alternatives. Descriptive explains what happened, diagnostic explores why, predictive estimates what may happen, and prescriptive evaluates what could be done next.
Common business data analysis techniques include statistical analysis, trend analysis, variance analysis, segmentation, correlation, regression, forecasting, cohort analysis, clustering, anomaly detection, and data visualization. For example, a marketing team can combine segmentation, trend analysis, and visualization to understand campaign performance across customer groups.
Statistical analysis uses numerical methods to summarize data, measure variation, test relationships, and support decisions under uncertainty. For example, a company can calculate average order value and standard deviation to understand both typical spending and variation between customers.
Statistical methods can include descriptive statistics, probability, hypothesis testing, confidence intervals, distributions, and statistical inference. Business statistics courses commonly teach descriptive measures, hypothesis testing, regression, probability, and data visualization as foundational analytical skills.
Source: Coursera, Business Statistics and Analysis, accessed 2026.
Regression analysis examines relationships between variables and can be used to estimate how an outcome changes when one or more explanatory variables change. For example, a business could examine whether advertising expenditure is associated with changes in sales while controlling for other relevant variables.
Trend analysis examines how a metric changes over time. For example, a company can chart monthly revenue over three years to identify sustained growth, seasonal patterns, or periods of decline.
Forecasting estimates future values using historical patterns and relevant assumptions. For example, an inventory team can forecast demand for the next quarter and use the estimate when planning purchasing levels.
Segmentation divides data into meaningful groups so businesses can compare behavior across different populations. For example, an online retailer can separate customers into new, returning, high-value, and inactive groups.
Correlation analysis measures the degree to which variables move together, but correlation alone does not establish causation. For example, website traffic and sales may rise together, but additional analysis is required before concluding that traffic directly caused the sales increase.
Cohort analysis compares groups that share a defined starting characteristic or time period. For example, a subscription business can compare retention among customers who joined in January, February, and March.
Anomaly detection identifies observations that differ substantially from an expected pattern. For example, a finance team can investigate an unusually large transaction that differs from a customer’s normal purchasing behavior.
Anomalies do not automatically indicate errors or fraud. Instead, they identify records or events that deserve investigation, which makes the technique useful for finance, cybersecurity, operations, quality control, and customer activity monitoring.
Data visualization converts analytical results into charts, graphs, dashboards, and other visual formats that make patterns easier to interpret. For example, a line chart can make a six-month sales decline immediately visible to a manager.
Visualization is most useful when it supports a specific question rather than simply displaying large amounts of data. A dashboard showing sales, margin, conversion rate, and inventory can help managers monitor performance and investigate changes.
Businesses apply data analysis techniques by connecting analytical methods to specific operational, financial, customer, and strategic questions. For example, the same company may use regression for sales analysis, segmentation for customer analysis, and forecasting for inventory planning.
| Business area | Typical question | Useful techniques |
| Sales | Which products or regions are performing differently? | Trend, variance, segmentation |
| Marketing | Which campaigns generate valuable customers? | Segmentation, cohort, correlation |
| Customer service | Why are complaints increasing? | Diagnostic, trend, segmentation |
| Finance | Where are the costs changing unexpectedly? | Variance, trend, anomaly detection |
| Operations | Where are bottlenecks occurring? | Trend, variance, anomaly detection |
| Inventory | How much stock may be required? | Forecasting, trend, regression |
| Human resources | Which workforce patterns need attention? | Segmentation, trend, statistical analysis |
First, sales teams can use sales data analysis to compare revenue by product, region, salesperson, customer group, or period. A sudden decline in one region can then become the subject of diagnostic analysis.
Second, marketing teams can combine customer data analysis with segmentation and cohort analysis to understand acquisition, engagement, retention, and purchasing behavior.
Third, operations teams can use trend analysis and anomaly detection to identify delays, capacity problems, unusual costs, or inventory issues. These techniques turn operational records into evidence that can guide process improvements.
Businesses can use spreadsheets, SQL databases, business intelligence platforms, statistical software, and Python or R environments for data analysis. For example, a small business may begin with a spreadsheet, while a larger organization may combine databases, BI dashboards, SQL, and analytical programming.
Spreadsheets are useful for smaller datasets, calculations, exploratory analysis, pivot tables, and straightforward reporting. For example, a business can use spreadsheet formulas and pivot tables to summarize monthly sales.
SQL is useful for extracting and combining structured data stored in databases. For example, an analyst can query customer and transaction tables to create a dataset for customer analysis.
Business intelligence platforms help teams query, visualize, monitor, and share business information. For example, managers can use dashboards to monitor revenue, conversion rates, inventory, and other performance indicators.
Common business analytics learning resources cover tools and skills such as Excel, Power BI, Tableau, SQL, statistical analysis, and data visualization. Source: Coursera, 2026.
Python and R are useful when analysis requires more statistical, programmatic, or automated workflows. For example, analysts can use programming environments for larger datasets, advanced statistical analysis, forecasting, and machine-learning workflows.
The right tool depends on data volume, complexity, required analysis, team skills, governance, cost, and reporting needs rather than the popularity of a particular platform.
The right data analysis technique is the method that best matches the business question, available data, desired outcome, data quality, and decision complexity. For example, a simple question about last month’s sales may require descriptive statistics, while a demand-planning problem may require forecasting.
Use this decision framework:
AWS recommends considering analytical objectives, data availability and quality, data volume and complexity, decision complexity, risk, scalability, and processing requirements when selecting analytics approaches. Source: Amazon Web Services, 2025.
A practical business data analysis process begins with a clear question and ends with measurable action and ongoing monitoring. For example, a retailer investigating declining sales should not begin by opening a dashboard; it should first define what sales decline needs to be explained.
Follow these steps:
Data cleansing deserves particular attention because missing, inaccurate, inconsistent, or incorrectly typed data can produce unreliable analytical results. AWS specifically recommends validating source data and monitoring data quality throughout the analytics process. Source: Amazon Web Services, 2025.
Data analysis techniques help businesses turn raw information into evidence that can support better decisions, planning, and performance improvement. Descriptive analysis explains what happened, diagnostic analysis investigates why it happened, predictive analysis estimates what may happen, and prescriptive analysis evaluates possible actions. Techniques such as statistical analysis, segmentation, correlation, regression, forecasting, cohort analysis, anomaly detection, and visualization provide practical ways to answer specific business questions. Effective business data analysis is not about creating the most complicated model or the most impressive dashboard. It is about asking the right question, using reliable data, selecting an appropriate technique, and turning the resulting insight into measurable action.